如何在python中使用subplot函數(shù)-創(chuàng)新互聯(lián)
這期內(nèi)容當(dāng)中小編將會(huì)給大家?guī)碛嘘P(guān)如何在python中使用subplot函數(shù),文章內(nèi)容豐富且以專業(yè)的角度為大家分析和敘述,閱讀完這篇文章希望大家可以有所收獲。

一、作圖流程:
1.準(zhǔn)備數(shù)據(jù), , 3作圖, 4定制, 5保存, 6顯示
1.數(shù)據(jù)可以是numpy數(shù)組,也可以是list
2創(chuàng)建畫布:
import matplotlib.pyplot as plt
#figure(num=None, figsize=None, dpi=None, facecolor=None, edgecolor=None, frameon=True)

#num:圖像編號(hào)或名稱,數(shù)字為編號(hào) ,字符串為名稱
#figsize:指定figure的寬和高,單位為英寸;
#dpi參數(shù)指定繪圖對(duì)象的分辨率,即每英寸多少個(gè)像素,缺省值為80 ,1英寸等于2.5cm,A4紙是 21*30cm的紙張
#facecolor:背景顏色
#edgecolor:邊框顏色
#frameon:是否顯示邊

fig = plt.figure()
fig = plt.figure(figsize=(8,6), dpi=80)

fig.add_axes()
fig, axes = plt.subplos(nrows = 2, ncols = 2) #axes是長(zhǎng)度為4的列表
3、作圖路線
一維數(shù)據(jù):
axes[0, 0].plot(x, y)
axes[0,1].bar([1,2,3], [2,4,8])
axes[0,2].barh([1,2,3], [2,4,8])
axes[1,0].axhline(0.45)
axes[1, 1].scatter(x, y)
axes[1,2].axvline(0.65)
axes[2,0].fill(x,y, color = 'blue')
axes[2,1].fill_between(x,y, color = 'blue')
axes[2,2].violinplot(y)
axes[0,3].arrow(0,0,0.5,0.5)
axes[1,3].quiver(x,y)
4, 定制
plt.plot(x,y, alpha=0.4, c = 'blue', maker = 'o')
#顏色,標(biāo)記,透明度

# 顯示數(shù)學(xué)文本

t = np.arange(0.0, 2.0, 0.01)
s = np.sin(2*np.pi*t)

plt.plot(t,s)
plt.title(r'$\alpha_i > \beta_i$', fontsize=20)
plt.text(1, -0.6, r'$\sum_{i=0}^\infty x_i$', fontsize=20)
plt.text(0.6, 0.6, r'$\mathcal{A}\mathrm{sin}(2 \omega t)$',
     fontsize=20)
plt.xlabel('time (s)')
plt.ylabel('volts (mV)')

fig = plt.figure()
fig.suptitle('bold figure suptitle', fontsize=14, fontweight='bold')

ax = fig.add_subplot(111)
fig.subplots_adjust(top=0.85)
ax.set_title('axes title')

ax.set_xlabel('xlabel')
ax.set_ylabel('ylabel')

ax.text(3, 8, 'boxed italics text in data coords', style='italic',
    bbox={'facecolor':'red', 'alpha':0.5, 'pad':10})

ax.text(2, 6, r'an equation: $E=mc^2$', fontsize=15)

ax.text(3, 2, u'unicode: Institut f\374r Festk\366rperphysik')

ax.text(0.95, 0.01, 'colored text in axes coords',
    verticalalignment='bottom', horizontalalignment='right',
    transform=ax.transAxes,
    color='green', fontsize=15)


ax.plot([2], [1], 'o')


# 注釋
ax.annotate('我是注釋啦', xy=(2, 1), xytext=(3, 4),color='r',size=15,
      arrowprops=dict(facecolor='g', shrink=0.05))

ax.axis([0, 10, 0, 10])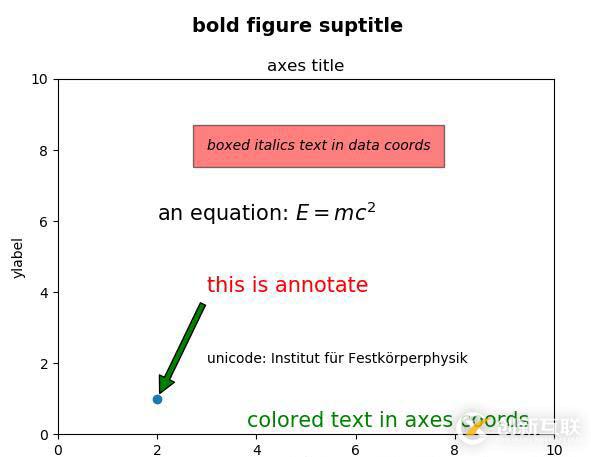
5, 保存顯示
plt.savefig("1.png")
plt.savefig("1.png", trainsparent =True)
plt.show()
二、部分函數(shù)使用詳解:
1, fig.add_subplot(numrows, numcols, fignum) ####三個(gè)參數(shù),分別代表子圖的行數(shù),列數(shù),圖索引號(hào)。 eg: ax = fig.add_subplot(2, 3, 1) (or ,ax = fig.add_subplot(231))
2, plt.subplots()使用
x = np.linspace(0, 2*np.pi,400)
y = np.sin(x**2)
fig, ax = plt.subplots()
ax.plot(x, y)
ax.set_title('Simple plot')
# Creates two subplots and unpacks the output array immediately
#fig = plt.figure(figsize=(6,6))
f, (ax1, ax2) = plt.subplots(1, 2, sharey=True)
ax1.plot(x, y)
ax1.set_title('Sharing Y axis')
ax2.scatter(x, y)
# Creates four polar axes, and accesses them through the returned array
fig, axes = plt.subplots(2, 2, subplot_kw=dict(polar=True))
axes[0, 0].plot(x, y)
axes[1, 1].scatter(x, y)
# Share a X axis with each column of subplots
plt.subplots(2, 2, sharex='col')
# Share a Y axis with each row of subplots
plt.subplots(2, 2, sharey='row')
# Share both X and Y axes with all subplots
plt.subplots(2, 2, sharex='all', sharey='all')
# Note that this is the same as
plt.subplots(2, 2, sharex=True, sharey=True)
# Creates figure number 10 with a single subplot
# and clears it if it already exists.
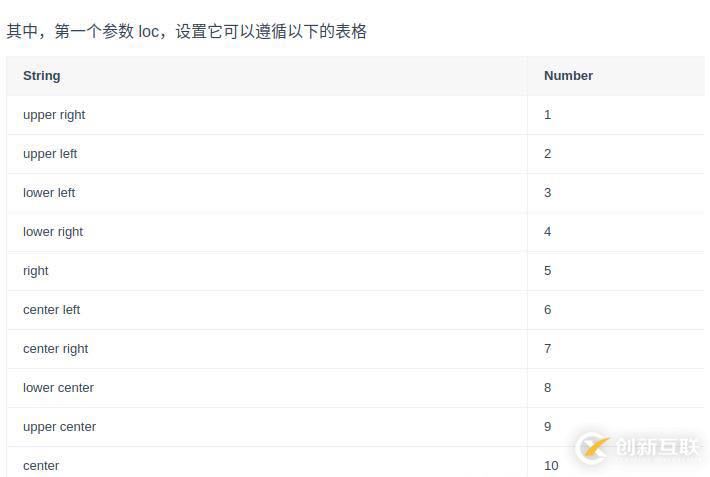
fig, ax=plt.subplots(num=10, clear=True)3.plt.legend()
plt.legend(loc='String or Number', bbox_to_anchor=(num1, num2))
plt.legend(loc='upper center', bbox_to_anchor (0.6,0.95),ncol=3,fancybox=True,shadow=True)
#bbox_to_anchor被賦予的二元組中,第一個(gè)數(shù)值用于控制legend的左右移動(dòng),值越大越向右邊移動(dòng),第二個(gè)數(shù)值用于控制legend的上下移動(dòng),值越大,越向上移動(dòng)
python主要應(yīng)用領(lǐng)域有哪些
1、云計(jì)算,典型應(yīng)用OpenStack。2、WEB前端開發(fā),眾多大型網(wǎng)站均為Python開發(fā)。3.人工智能應(yīng)用,基于大數(shù)據(jù)分析和深度學(xué)習(xí)而發(fā)展出來的人工智能本質(zhì)上已經(jīng)無法離開python。4、系統(tǒng)運(yùn)維工程項(xiàng)目,自動(dòng)化運(yùn)維的標(biāo)配就是python+Django/flask。5、金融理財(cái)分析,量化交易,金融分析。6、大數(shù)據(jù)分析。
上述就是小編為大家分享的如何在python中使用subplot函數(shù)了,如果剛好有類似的疑惑,不妨參照上述分析進(jìn)行理解。如果想知道更多相關(guān)知識(shí),歡迎關(guān)注創(chuàng)新互聯(lián)成都網(wǎng)站設(shè)計(jì)公司行業(yè)資訊頻道。
另外有需要云服務(wù)器可以了解下創(chuàng)新互聯(lián)scvps.cn,海內(nèi)外云服務(wù)器15元起步,三天無理由+7*72小時(shí)售后在線,公司持有idc許可證,提供“云服務(wù)器、裸金屬服務(wù)器、高防服務(wù)器、香港服務(wù)器、美國服務(wù)器、虛擬主機(jī)、免備案服務(wù)器”等云主機(jī)租用服務(wù)以及企業(yè)上云的綜合解決方案,具有“安全穩(wěn)定、簡(jiǎn)單易用、服務(wù)可用性高、性價(jià)比高”等特點(diǎn)與優(yōu)勢(shì),專為企業(yè)上云打造定制,能夠滿足用戶豐富、多元化的應(yīng)用場(chǎng)景需求。
新聞名稱:如何在python中使用subplot函數(shù)-創(chuàng)新互聯(lián)
網(wǎng)頁網(wǎng)址:http://chinadenli.net/article2/ephic.html
成都網(wǎng)站建設(shè)公司_創(chuàng)新互聯(lián),為您提供關(guān)鍵詞優(yōu)化、電子商務(wù)、企業(yè)網(wǎng)站制作、網(wǎng)站建設(shè)、用戶體驗(yàn)、移動(dòng)網(wǎng)站建設(shè)
聲明:本網(wǎng)站發(fā)布的內(nèi)容(圖片、視頻和文字)以用戶投稿、用戶轉(zhuǎn)載內(nèi)容為主,如果涉及侵權(quán)請(qǐng)盡快告知,我們將會(huì)在第一時(shí)間刪除。文章觀點(diǎn)不代表本網(wǎng)站立場(chǎng),如需處理請(qǐng)聯(lián)系客服。電話:028-86922220;郵箱:631063699@qq.com。內(nèi)容未經(jīng)允許不得轉(zhuǎn)載,或轉(zhuǎn)載時(shí)需注明來源: 創(chuàng)新互聯(lián)

- 醫(yī)院網(wǎng)站建設(shè)有什么解決方案 2020-12-28
- 高校網(wǎng)站開發(fā)存在的問題和解決方案 2021-09-13
- 數(shù)碼網(wǎng)站建設(shè)解決方案 2022-04-23
- 社區(qū)網(wǎng)站建設(shè)解決方案 2022-03-11
- 網(wǎng)絡(luò)營銷網(wǎng)站建設(shè)解決方案 2023-01-05
- 網(wǎng)站跳出率太高怎么辦?SEO優(yōu)化人員必知的解決方案 2020-09-11
- 百度推廣效果不佳的專業(yè)解決方案 2022-06-07
- 母嬰用品網(wǎng)站分析及網(wǎng)站制作解決方案 2023-03-19
- 旅游網(wǎng)站制作維護(hù)和解決方案 2021-10-01
- 企業(yè)網(wǎng)站建設(shè)解決方案 2023-02-22
- 成都網(wǎng)站建設(shè)分享集團(tuán)網(wǎng)站建設(shè)的解決方案 2015-01-18
- 外貿(mào)網(wǎng)站推廣方法解決方案 2016-04-01